Note: This article synthesizes publicly available research and guidance from leading analytics, BI, cloud, UX, and SaaS product sources, including major U.S.-based technology providers, analyst firms, and embedded analytics vendors. It is written as original editorial content for web publishing.
Introduction: Users Don’t Want Another Dashboard. They Want Answers.
Embedded analytics has become one of the most requested features in B2B software, and for good reason. Your customers are tired of exporting CSV files, emailing spreadsheets, waiting for custom reports, and asking support teams questions that begin with, “Can you pull the numbers for…?” In 2026, that workflow feels about as modern as faxing a screenshot.
But adding embedded analytics to a B2B app is not simply a matter of dropping a dashboard into an iframe and calling it innovation. Users can smell a bolted-on dashboard from three browser tabs away. What they actually want is much more specific: trusted metrics, fast performance, role-based views, flexible reporting, secure data access, clean design, and insights that help them act without leaving the product.
For SaaS companies, independent software vendors, and B2B product teams, embedded analytics is no longer a “nice-to-have” feature. It can improve product stickiness, create premium pricing opportunities, reduce support requests, and make the application feel more valuable every time users log in. The catch? If the analytics experience is confusing, slow, or poorly governed, it can do the opposite. Nothing ruins confidence faster than a chart that loads like it is personally offended by the internet.
This research-based analysis breaks down what B2B users really want from embedded analytics, how product teams should prioritize features, and why the best analytics experiences feel less like reporting tools and more like decision-making assistants built directly into the workflow.
What Is Embedded Analytics in a B2B App?
Embedded analytics is the integration of dashboards, reports, visualizations, metrics, data exploration, or AI-powered insights directly inside another software product. Instead of forcing users to open a separate business intelligence platform, the application brings analytics into the place where work already happens.
In a B2B SaaS product, embedded analytics might appear as a customer performance dashboard, a sales pipeline report, a supply chain visibility panel, a healthcare operations view, a marketing attribution screen, or a finance reconciliation report. The key point is simple: users should not have to leave the app to understand what is happening in the app.
Embedded Analytics vs. Traditional BI
Traditional BI tools are usually built for internal analysts, executives, and data teams. Embedded analytics is different because it is often customer-facing. That means the audience may include nontechnical users, client administrators, managers, partners, vendors, or external customers who just want to answer a business question quickly.
This difference changes everything. Internal BI can tolerate some complexity because analysts are trained to use it. Customer-facing analytics cannot. It must be intuitive, secure, branded, fast, and easy to understand without a 47-slide onboarding deck. If your analytics feature needs a webinar, a glossary, and emotional support, it probably needs better product design.
Research Pattern: Users Want Analytics in the Workflow
Across embedded analytics research, SaaS vendor reports, cloud documentation, and UX guidance, one theme appears repeatedly: users want insights inside their normal workflow. They do not want to switch tools, download files, rebuild charts, or wait for a data team to answer routine questions.
This is especially important in B2B apps because users often make decisions under time pressure. A logistics manager needs to know which shipments are delayed. A sales leader wants to know which accounts are at risk. A marketing team wants to see which campaigns are producing pipeline. A customer success manager wants to identify adoption drops before renewal conversations become awkward.
Embedded analytics works best when it shortens the path from data to decision. The goal is not to display every possible metric. The goal is to help users understand what changed, why it changed, and what they should do next.
What Users Want Most from Embedded Analytics
1. Fast, Reliable Performance
Speed is not a luxury in embedded analytics. It is part of the user experience. If dashboards take too long to load, users will stop trusting them, even if the data is technically correct. In B2B software, performance directly affects perceived product quality.
Users expect dashboards to load quickly, filters to respond immediately, and drilldowns to feel smooth. A slow analytics tab sends the wrong message: “Your data is important, but please enjoy this loading spinner while we think about it.”
Product teams should design for performance from the beginning. That means caching where appropriate, optimizing queries, limiting unnecessary visual complexity, pre-aggregating large datasets, and monitoring dashboard load times like core product metrics. Embedded analytics should feel native, not like a heavy guest who brought three suitcases and clogged the hallway.
2. Trusted Metrics and Clear Definitions
Users want to trust the numbers. This sounds obvious until you see three dashboards showing three different versions of revenue, each with its own mysterious logic. In B2B apps, trust is the foundation of analytics adoption.
Every important metric should have a clear definition. What counts as an active user? How is churn calculated? Does revenue include discounts, refunds, taxes, or only booked contract value? If users cannot understand the definition, they will challenge the result. If they challenge the result often enough, they will stop using the feature.
Strong embedded analytics products use governed data models, semantic layers, metric documentation, and role-based access controls. They make data definitions visible without making users dig through technical documentation. A small tooltip explaining a KPI can prevent a surprisingly large amount of conference-room drama.
3. Role-Based and Personalized Views
Different users need different answers. An executive may want a high-level trend. An operations manager may need exceptions. A frontline user may only care about today’s tasks. If everyone sees the same dashboard, most people are seeing too much or too little.
Role-based analytics helps users start with the view most relevant to their job. This does not mean hiding flexibility. It means giving users a useful default experience. For example, an account administrator may see company-wide usage trends, while a team manager sees performance for their own department.
Personalization can also include saved filters, custom date ranges, favorite reports, preferred chart types, and configurable home dashboards. The best embedded analytics experiences feel like they understand the user’s job before the user has to explain it.
4. Self-Service Without Chaos
Self-service analytics is one of the biggest user demands in modern B2B apps. Users want to create reports, adjust filters, drill into data, compare segments, and answer follow-up questions without filing a ticket. That is the dream.
The nightmare is uncontrolled self-service, where every user creates their own version of the truth and the product slowly becomes a haunted mansion of duplicate reports.
The solution is guided self-service. Give users enough flexibility to explore, but protect the core metrics and data relationships. Offer templates, approved datasets, clear permissions, reusable measures, and guardrails that prevent users from accidentally building a chart that suggests Tuesday caused revenue.
5. Secure Multi-Tenant Data Access
Security is non-negotiable in customer-facing analytics. In a B2B app, one customer must never see another customer’s data. That is not a feature request. That is a survival requirement.
Modern embedded analytics architecture often relies on tenant isolation, row-level security, session-based permissions, signed embed URLs, identity mapping, and backend authorization checks. The user experience may look simple, but the security model behind it must be carefully designed.
Users may not ask for row-level security by name, but they absolutely expect it. They also expect auditability, access controls, admin permissions, and confidence that the analytics layer follows the same security standards as the rest of the application.
6. Native Product Experience
Embedded analytics should feel like part of the product, not a visiting dashboard wearing a fake mustache. Users want consistent navigation, typography, colors, terminology, permissions, and workflows.
A native experience matters because it reduces friction. Users should not feel like they have been transported into a separate BI platform with different buttons, different rules, and a different personality. White labeling, theme control, custom components, and API-level integration all help create a seamless experience.
For product teams, this is where build-versus-buy decisions become important. Some embedded BI platforms offer fast dashboard deployment but limited UI control. Others provide more developer flexibility but require more engineering work. The right choice depends on whether analytics is a supporting feature or a core part of the product’s value proposition.
7. Drilldowns, Filters, and Explainability
Users rarely stop at the first chart. A dashboard says revenue dropped. The next question is: where? Then: why? Then: which customers? Then: what changed last week? Good embedded analytics supports this natural question chain.
Interactive filters, drilldowns, cross-filtering, segmentation, and comparison tools help users move from summary to explanation. Without these features, dashboards become decorative scoreboards. Pretty, perhaps, but not very helpful when someone asks what to do next.
Explainability is also becoming more important as AI-powered analytics enters B2B applications. Users may welcome natural language questions, automated insights, and anomaly detection, but they still need to understand how conclusions were generated. AI should not behave like a mystical spreadsheet oracle. It should show its work.
8. Alerts and Actionable Insights
Users do not want to babysit dashboards all day. They want the system to tell them when something important changes. Alerts, notifications, scheduled reports, anomaly detection, and threshold-based triggers can turn embedded analytics from a passive reporting area into an active decision system.
For example, a customer success platform might alert a manager when product usage drops below a healthy threshold. A finance app might notify users when expenses exceed a budget category. A supply chain platform might flag late deliveries or inventory risk.
The best alerts are specific, timely, and actionable. The worst alerts are vague, constant, and panic-flavored. Product teams should let users control notification frequency, channels, thresholds, and recipients.
Embedded Analytics Features Users Actually Use
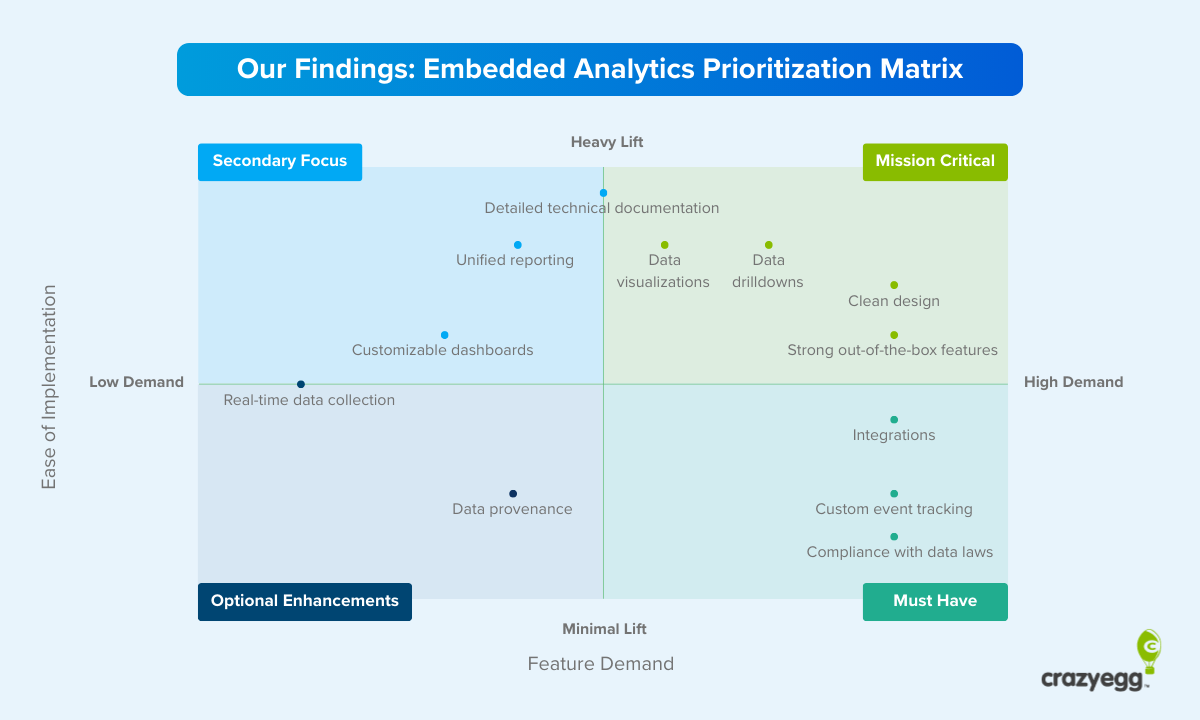
Not every analytics feature deserves top priority. Based on common user needs and product adoption patterns, B2B teams should focus first on features that reduce friction and answer high-frequency questions.
High-Value Feature Checklist
- Executive summary dashboards: High-level KPIs, trends, and alerts for quick review.
- Operational dashboards: Role-specific views for daily monitoring and decision-making.
- Interactive filters: Date, region, team, product, customer segment, and status controls.
- Drilldowns: The ability to move from summary metrics into detail.
- Custom reports: Guided report-building for power users and admins.
- Exports: CSV, PDF, image, spreadsheet, and scheduled email delivery.
- Embedded AI: Natural language queries, anomaly explanations, and automated summaries.
- Security controls: Tenant-aware access, row-level permissions, and audit logs.
- Admin configuration: User roles, default dashboards, and permission management.
Exports deserve a special mention. Product teams sometimes treat exports as old-fashioned, but B2B users still need them for board decks, audits, client reports, and offline workflows. The goal is not to eliminate exports entirely. The goal is to make users export because they need to share, not because the in-app analytics experience is unusable.
Common Mistakes When Adding Embedded Analytics
Mistake 1: Starting with Charts Instead of User Questions
The worst analytics projects begin with, “What charts should we add?” The better question is, “What decisions are users trying to make?”
Before designing dashboards, interview users, review support tickets, analyze reporting requests, and identify the questions customers ask repeatedly. If users constantly ask, “Which accounts are slipping?” build analytics around account risk. Do not bury that answer under twelve vanity metrics and a pie chart that exists because someone discovered the chart menu.
Mistake 2: Treating Embedded Analytics as a Separate Product
Analytics should connect to workflows. If a user spots a problem, what happens next? Can they assign a task, open a record, send a report, update a forecast, or trigger a workflow? If not, the dashboard may create awareness without enabling action.
The strongest B2B analytics experiences connect insights to product actions. A chart should not be the end of the journey. It should be the beginning of a smarter workflow.
Mistake 3: Ignoring Data Freshness
Users care deeply about whether data is live, delayed, refreshed hourly, or updated overnight. If freshness is unclear, they may assume the data is wrong.
Every embedded analytics view should communicate data freshness clearly. Add timestamps, refresh indicators, and explanations for delayed data. In high-stakes use cases, consider real-time or near-real-time pipelines. In less urgent scenarios, batch updates may be fine, but users should never have to guess.
Mistake 4: Overloading the Dashboard
Dashboard clutter is the natural enemy of decision-making. When every metric is important, no metric is important. Strong dashboard UX uses hierarchy, spacing, grouping, plain language, and visual emphasis to guide the eye.
A good dashboard answers a small number of important questions well. A bad dashboard answers every question poorly while looking like a cockpit designed by a committee of caffeinated raccoons.
Build vs. Buy: What Product Teams Should Consider
When adding embedded analytics to a B2B app, teams usually face a major decision: build the analytics experience internally or buy an embedded analytics platform.
Building internally gives full control over UI, data models, performance, and feature roadmap. It may be the right choice when analytics is the core product or when the experience must be deeply custom. However, it also requires significant engineering investment, ongoing maintenance, visualization work, permissions logic, export functionality, scaling, and support.
Buying an embedded analytics platform can speed up time to market. Many platforms already provide dashboards, reporting, white labeling, security features, APIs, SDKs, and self-service tools. The trade-off is that customization, pricing, performance, or product fit may vary.
The smartest teams evaluate build versus buy based on user expectations, engineering capacity, security requirements, UI flexibility, data complexity, pricing model, and long-term roadmap. Do not choose a platform only because the demo looked smooth. Demos are where software wears its nicest shoes.
How AI Is Changing Embedded Analytics
AI is quickly becoming part of embedded analytics, especially through natural language queries, automated summaries, anomaly detection, forecasting, and conversational analytics. For B2B users, AI can make analytics more accessible by allowing people to ask questions in plain English instead of learning report builders.
However, AI analytics must be handled carefully. Users want convenience, but they also want trust. AI-generated insights should include context, definitions, confidence signals, and links back to the underlying data. If an AI summary says, “Renewal risk increased,” users should be able to see which accounts contributed to that conclusion and why.
The best use of AI in embedded analytics is not to replace dashboards entirely. It is to reduce the effort required to interpret them. AI can highlight what changed, suggest next questions, explain anomalies, and help nontechnical users explore data without feeling lost.
Practical Framework: How to Add Embedded Analytics Users Will Love
Step 1: Identify the Top User Decisions
List the decisions your users make inside your product. Prioritize decisions that are frequent, valuable, and currently painful. Build analytics around those moments.
Step 2: Define Trusted Metrics
Create a controlled metric layer with clear definitions, ownership, and governance. If users debate the number, fix the definition before adding more charts.
Step 3: Design Role-Based Experiences
Create dashboards for specific user roles. Executives, admins, managers, and operators should not all land on the same analytics page.
Step 4: Build for Exploration
Support filters, drilldowns, saved views, and guided self-service. Let curious users go deeper without overwhelming casual users.
Step 5: Secure Everything
Plan tenant isolation, permissions, row-level security, audit trails, and access testing before launch. Security should not be sprinkled on later like dashboard parsley.
Step 6: Measure Analytics Adoption
Track dashboard usage, report creation, filter interactions, exports, alert subscriptions, load times, and support ticket reduction. Embedded analytics is a product feature, so manage it like one.
Experience-Based Insights: What Really Happens After You Launch Embedded Analytics
Here is the part product teams often learn the hard way: launching embedded analytics is not the finish line. It is the moment users begin telling you what they actually wanted all along.
At first, most teams think users want dashboards. After launch, they discover users want answers. Then they discover different users want different answers. Then enterprise customers want custom metrics. Then admins want permission controls. Then someone asks whether the dashboard can be exported every Monday at 8:00 a.m. and sent to twelve people, three of whom do not use the app. Welcome to B2B analytics. Please keep your hands inside the vehicle.
One common experience is that the first version is too generic. Product teams often create a broad overview dashboard because it feels safe. It includes total users, revenue, activity, trends, and a few colorful charts. It looks impressive in a sales demo, but daily users may ignore it because it does not map to their specific jobs. A customer success manager does not need a museum of metrics. They need to know which accounts require attention today.
Another lesson is that power users appear quickly. Even if most users only need simple dashboards, a smaller group will want custom reports, advanced filters, calculated fields, and saved views. These users are valuable because they often become internal champions. However, they can also create complexity if the product lacks governance. Give them flexibility, but protect shared definitions.
Data freshness also becomes a bigger issue than expected. Users will ask why a number changed, why it does not match another report, when the data refreshed, and whether the export includes the latest records. A simple “last updated” label can prevent many support conversations. A clear data dictionary can prevent even more.
Performance feedback is brutally honest. Users may forgive a slow admin settings page. They rarely forgive slow analytics. When users open a dashboard, they are usually trying to answer a question now. If the page stalls, confidence drops. The analytics feature may be technically powerful, but users experience it as slow. In product terms, perception wins.
There is also a monetization lesson. Embedded analytics can support premium packaging, but only if the value is obvious. Charging extra for basic visibility can frustrate users. Charging for advanced reporting, benchmarking, AI insights, custom dashboards, scheduled delivery, or enterprise governance is usually easier to justify. The packaging should match the maturity of the customer, not simply the number of charts available.
The most successful teams treat embedded analytics as an evolving product surface. They collect feedback, watch usage, identify abandoned dashboards, improve defaults, and add features based on real behavior. They also involve customer-facing teams, because sales, success, and support know which questions customers ask before renewal, onboarding, and expansion.
The biggest lesson is simple: analytics should make the product feel smarter. When users can see outcomes, understand trends, and take action without leaving the app, the software becomes harder to replace. That is the real power of embedded analytics. It is not just a dashboard. It is evidence that your product is working.
Conclusion: The Best Embedded Analytics Feels Invisible
Adding embedded analytics to your B2B app can make your product more valuable, more engaging, and more defensible. But success depends on understanding what users actually want. They want fast answers, trusted metrics, role-based views, secure access, useful drilldowns, clean design, and insights connected to action.
The best embedded analytics does not feel like a separate BI tool squeezed into your app. It feels like a natural extension of the product. It helps users answer questions at the exact moment those questions matter. It reduces dependency on support teams and manual reporting. It gives customers confidence that they can understand their own performance without becoming part-time data engineers.
For B2B product teams, the message is clear: do not build dashboards for dashboards’ sake. Build decision experiences. Start with user questions, govern your metrics, design for roles, secure the data, optimize performance, and keep improving after launch. Do that well, and embedded analytics becomes more than a feature. It becomes one of the reasons customers stay.