For investors, a decade can feel like forever. Ten years is enough time to change careers, raise a child from kindergarten to high school, or finally admit that the exercise bike in the basement has become an expensive coat rack. Yet in the stock market, even ten years can be only one chapter in a much longer story.
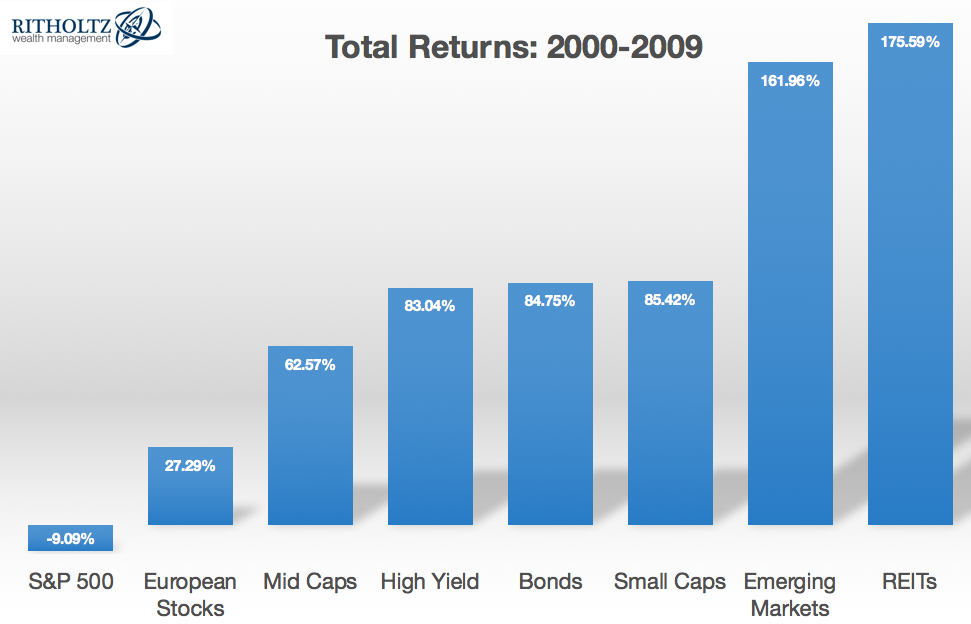
The period from 2000 through 2009 is widely remembered as the lost decade for U.S. large-cap stocks. The S&P 500 endured the collapse of the dot-com bubble, a recession, a housing boom, the global financial crisis, and one of the most frightening market crashes in modern history. From January 2000 through December 2009, the index produced a cumulative total return of roughly negative 9.1%, or about negative 0.95% annualized. An investor could patiently hold for ten calendar years and still finish with less than expected. That is not exactly the brochure Wall Street hands out on orientation day.
But the lost decade also created one of the clearest modern examples of why mean reversion, valuation, diversification, and investor behavior matter. The years that followed looked radically different. According to historical return data compiled by NYU professor Aswath Damodaran, the S&P 500 generated approximately 13.4% annualized total returns from 2010 through 2019. A miserable decade was followed by a remarkably strong one.
That does not mean markets operate like a vending machine where ten bad years automatically produce ten good ones after you insert another dollar. Mean reversion is more complicated, less punctual, and considerably less polite. Still, the lost decade offers valuable lessons about how market cycles workand why investors should be cautious about assuming that yesterday’s winners will remain tomorrow’s champions.
What Does Mean Reversion Mean in Investing?
Mean reversion is the idea that unusually high or low conditions may eventually move back toward a more typical long-term range. In financial markets, the concept can apply to valuations, profit margins, relative asset-class performance, interest rates, and, more controversially, long-horizon stock returns.
Imagine stretching a rubber band. The farther it moves from its normal position, the more attention investors pay to the possibility that it could snap back. Markets are not actual rubber bands, of course. They have no fixed center, and economic fundamentals change over time. Still, extreme optimism can push valuations well above historical norms, while extreme pessimism can push prices below levels justified by long-term business prospects.
Academic research has found evidence consistent with some long-horizon mean reversion in stock returns. Classic research examining U.S. and international market data found positive correlation over shorter periods but negative autocorrelation over longer horizons, suggesting that unusually strong or weak stretches may not continue indefinitely. The evidence, however, does not create a reliable calendar for predicting turning points.
Mean Reversion Is a Tendency, Not a Trading Signal
This distinction is crucial. Saying that valuations or returns may mean-revert over long periods is not the same as saying, “The market is expensive, so sell everything Tuesday morning.”
An expensive market can become more expensive. A cheap market can stay cheap for years. A struggling asset class can remain unpopular long enough to make even disciplined investors question every life decision that led them to own it.
Mean reversion works better as a framework for understanding expectations than as a precise market-timing tool. Starting valuations can influence long-run return potential, but they usually tell investors much less about what will happen next month or next quarter.
How the Lost Decade Was Created
The 1990s Set the Stage
To understand the 2000s, it helps to begin with the extraordinary bull market of the 1990s. Technology transformed business, the internet captured investors’ imaginations, and growth stocks became market celebrities. By the end of the decade, investors were willing to pay increasingly aggressive prices for companies associated with the digital future.
Some of those companies eventually became extraordinary businesses. Others had little more than a website, a hopeful business plan, and a stock ticker. The market temporarily decided these distinctions were optional.
High prices do not necessarily cause an immediate crash, but they can reduce the margin for disappointment. When expectations embedded in stock prices become extremely optimistic, future returns increasingly depend on companies producing exceptional results. Even good news may no longer be good enough.
The Dot-Com Bust Delivered the First Blow
When the technology bubble burst, many speculative stocks collapsed. The broader market suffered as well. The S&P 500 posted negative total returns in 2000, 2001, and 2002. Historical data show declines of approximately 9.0%, 11.9%, and 22.0%, respectively.
Then the market recovered. By the middle of the decade, the worst appeared to be over. Investors who had survived the technology crash could reasonably believe the lost decade was merely a rough opening act.
Unfortunately, the financial system had another surprise waiting backstage.
The Financial Crisis Finished the Job
The housing and credit boom eventually gave way to the 2007–2009 financial crisis. In 2008 alone, the S&P 500 lost roughly 36.6% on a total-return basis. The market then rebounded strongly in 2009, but the damage to the decade’s cumulative result had already been done.
Historical drawdown research illustrates how severe the experience felt. The broad stock market fell roughly 54% during the extended period surrounding the dot-com bust and financial crisis, with a prolonged journey back to its previous high. A diversified 60/40 stock-and-bond portfolio experienced a substantially shallower decline during the same broad episode.
That comparison contains an important lesson: the lost decade was not necessarily a lost decade for every investor.
The Lost Decade Was Not Lost Everywhere
One of the biggest mistakes investors make is treating “the market” as though it were a single investment. U.S. large-cap stocks struggled during the 2000s, but other parts of global markets produced very different results.
International stocks, emerging markets, smaller companies, bonds, and various value-oriented investments experienced different return patterns. S&P Global’s historical analysis notes that while the S&P 500 produced a negative cumulative return from 2000 through 2009, major markets outside the United States generated positive returns over the period.
This is why portfolio diversification is not merely a collection of investments that all rise together while wearing different ticker symbols. Real diversification means owning assets whose leadership can change across economic environments.
Fidelity describes diversification as spreading investments across multiple asset classes to help reduce portfolio volatility, while Vanguard emphasizes broad balance and discipline during turbulent markets. Diversification cannot guarantee profits or eliminate losses, but it can reduce dependence on one country, sector, style, or market narrative.
The Mean Reversion That Followed
The 2010s provided a dramatic contrast to the previous decade. U.S. stocks emerged from the financial crisis with lower valuations, damaged investor confidence, improving corporate profitability, technological innovation, and a long economic expansion.
The S&P 500 delivered positive total returns in nine of the ten calendar years from 2010 through 2019. The decade included exceptionally strong years such as 2013 and 2019, when total returns exceeded 30%. Compounded across the full period, the index returned about 13.4% annually based on historical return data.
Was that pure mean reversion? Not entirely.
Returns come from several sources: dividends, earnings growth, changes in valuation multiples, and the interaction among them. The post-crisis period benefited from improving fundamentals and, over time, rising valuations. Therefore, the recovery should not be reduced to a simplistic rule that “bad decades create good decades.”
Still, the contrast demonstrates a broader principle: extremely disappointing performance often changes the conditions that produced it. Prices fall. Expectations decline. Weak businesses disappear. Strong businesses adapt. Investors become more cautious. Assets that were once wildly popular can become ignored, while previously neglected opportunities become more attractive.
Meanwhile, long periods of outstanding performance can create the opposite conditions. Rising prices increase optimism. Optimism attracts capital. Capital pushes prices higher. Eventually, investors may begin paying more for each dollar of earnings, meaning future returns require increasingly impressive business results.
Why Investors Struggle With Mean Reversion
We Naturally Chase What Recently Worked
Human beings are excellent pattern-recognition machines. Unfortunately, financial markets occasionally reward us for recognizing a pattern immediately before changing the pattern.
After a decade of poor returns, investors often conclude that an asset class is permanently broken. After a decade of extraordinary gains, they may conclude that the winning asset is uniquely superior and deserves a larger portfolio allocation.
This is performance chasing in its natural habitat.
The lost decade made U.S. stocks look deeply disappointing at precisely the moment when the following decade was about to become far better. Later, years of strong U.S. equity performance made international diversification appear unnecessary to many investors, even though market leadership has historically rotated across countries and asset classes.
Recent Returns Feel More Important Than Starting Valuations
Investors frequently use the rearview mirror to estimate the road ahead. If stocks returned strongly during the last several years, expectations for future returns often rise. Yet high past returns can partly reflect expanding valuationsand higher valuations may reduce the return potential available to new buyers.
The reverse can also happen. Weak markets feel dangerous because recent losses are visible and emotionally painful. But falling prices can improve prospective returns when underlying fundamentals remain durable.
This creates one of investing’s great annoyances: opportunities often feel least comfortable when they are most interesting.
What the Lost Decade Teaches Long-Term Investors
1. A Ten-Year Horizon Is Long, but Not Magical
Investors often hear that stocks are for the long term, which is generally sound guidance. But “long term” does not mean every randomly selected ten-year period will produce wonderful results.
The lost decade is a reminder that sequence matters. Someone investing a lump sum near a major valuation peak can experience years of frustration. An investor making regular contributions throughout a downturn, however, may buy more shares at lower prices and experience a very different result.
2. Diversification Is Most Valuable Before You Need It
Diversification often feels disappointing during periods when one asset class dominates. Investors look at the laggards in their portfolios and wonder why they own them.
That is a little like complaining about a fire extinguisher because the kitchen is not currently on fire.
A diversified portfolio will almost always contain something that looks less exciting than the current winner. That is not necessarily a flaw. It may be evidence that the portfolio contains genuinely different sources of risk and return.
3. Rebalancing Turns Mean Reversion Into a Process
Rebalancing means periodically restoring a portfolio to its intended asset allocation. When one investment category dramatically outperforms, its portfolio weight grows. Rebalancing may involve trimming some of the winner and adding to areas that have lagged.
This does not guarantee higher returns. It does, however, create a disciplined method for managing risk and reducing the tendency to chase performance.
In effect, rebalancing forces investors to do something emotionally difficult: sell a little of what everyone loves and buy a little of what currently inspires awkward silence at dinner parties.
4. Staying Invested Is Different From Ignoring Risk
A long-term strategy does not require pretending that valuations, risk tolerance, or financial goals do not exist. Investors should maintain an asset allocation appropriate for their time horizon and ability to withstand losses.
Once that structure is in place, however, repeatedly moving in and out of markets based on fear or forecasts can create new risks. Research and investor guidance from Vanguard, Schwab, and J.P. Morgan consistently emphasize the difficulty of market timing and the importance of maintaining a disciplined long-term plan. Schwab’s historical analysis, for example, found that waiting indefinitely for the perfect entry point could be more damaging than investing at imperfect times.
Mean Reversion Is Not a Promise
The most dangerous interpretation of mean reversion is the belief that every losing investment must eventually recover.
It will not.
Individual companies can fail. Industries can shrink. Technologies can become obsolete. Countries can experience decades of structural problems. An individual stock falling 80% does not become a bargain simply because it has demonstrated impressive enthusiasm for falling.
Mean reversion makes more conceptual sense when discussing diversified markets, valuation spreads, or broad asset classes than when assuming a broken company must return to its former price.
Investors should also remember that the “mean” itself can change. Economies evolve. Interest rates change. Market composition shifts. Accounting standards improve. Technology alters profit structures. A historical average is a reference point, not a law of physics.
A Practical Experience: Living Through a Lost Decade
Consider the experience of a hypothetical investor named Daniel, who began investing seriously in early 2000. This is a composite example rather than the story of one specific person, but it reflects the emotional challenges many long-term investors faced during the period.
Daniel entered the market after watching stocks rise throughout much of the 1990s. Technology companies were changing the world, financial media celebrated enormous gains, and almost everyone seemed to know someone who had doubled money in a stock with a name ending in “.com.” Daniel did what many reasonable people do after watching other people become wealthier: he decided that now was an excellent time to become brave.
Then the market fell.
At first, the decline looked temporary. Then 2000 became a bad year. So did 2001. Then 2002 arrived and apparently decided the previous two years had not been sufficiently educational.
Daniel’s first instinct was to stop investing until conditions became “clearer.” The problem was that clarity never sent him a calendar invitation. By the time the market recovery looked convincing, prices had already risen substantially.
He eventually adopted a simpler system. He continued contributing to his retirement account every month, maintained a mix of U.S. stocks, international stocks, and high-quality bonds, and rebalanced periodically. The process was boring. This turned out to be one of its best features.
By 2007, the portfolio had recovered significantly. Daniel began to feel optimistic again. Then came the financial crisis. Banks failed, unemployment rose, stock prices collapsed, and financial television developed the emotional atmosphere of an airport departure board during a hurricane.
This second crash was psychologically harder than the first. Daniel had already spent years recovering. Losing ground again felt unfair, as though the market had violated an agreement it had never actually signed.
But the diversified portfolio behaved differently from an all-stock portfolio. Bonds provided stability. Continuing contributions purchased shares at lower prices. Rebalancing required adding to stocks when fear was widespreadan action that felt uncomfortable but followed the plan established before the crisis.
The most important lesson did not arrive in 2009 or even 2010. It became obvious only years later. Daniel realized that the financial decisions that mattered most had been made when the future looked least obvious.
He could not predict the dot-com collapse. He could not predict the financial crisis. He also could not predict the strength of the bull market that followed. What he could control was diversification, savings, fees, taxes, risk exposure, and whether panic would be allowed to rewrite his investment strategy.
That experience changes how an investor views mean reversion. It stops looking like a clever prediction and starts looking like a reason for humility. Markets rotate. Expectations overshoot. Fear and enthusiasm both become contagious. The investment that looks invincible can disappoint, while the asset nobody wants to discuss can quietly become tomorrow’s winner.
Most importantly, a lost decade does not mean the investor has lostunless the experience causes that investor to abandon a sensible plan permanently. A decade of poor market returns is painful. A decade spent buying diversified assets at progressively better prices can also create the foundation for future wealth.
Conclusion: The Real Lesson of Mean Reversion From the Lost Decade
The lost decade was not proof that stocks do not work, nor was the powerful decade that followed proof that stocks always deliver double-digit returns. Together, the two periods demonstrate something more useful: market leadership, valuations, expectations, and returns move in cycles.
Mean reversion helps explain why investors should be skeptical of permanent narratives. The best-performing market of the recent past may not dominate forever. The worst-performing asset class may not remain hopeless. But neither outcome can be timed with confidence.
The practical response is not to predict every reversal. It is to build a portfolio capable of surviving surprises. Diversify broadly. Rebalance thoughtfully. Match risk to financial goals. Continue investing when appropriate. Avoid turning recent performance into a prophecy.
The lost decade looked permanent while investors were living through it. The strong decade that followed also tempted many people to believe a new permanent pattern had arrived. Markets enjoy humbling anyone who becomes too certain.
Perhaps that is the most important form of mean reversion of all: eventually, investor confidence has a way of returning to humility.
Note: This article is for educational and informational purposes only and does not constitute personalized investment, tax, or financial advice. Investment returns are not guaranteed, and past performance does not predict future results.